Corda 5—Unveiling the P2P Preview
May 26, 2022
By Dimos Raptis, Senior Staff Software Engineer
We are really excited to present to you today the first preview of the new peer-to-peer communications layer of Corda 5, which is now open source. If you are not familiar with what Corda 5 aspires to deliver, we highly recommend reading the previous “Corda 5 the road ahead” blog post series from R3’s product management team. This preview is a good indication of how Corda 5 delivers on the areas of multi-tenancy, horizontal scalability and high availability.
This post consists of 3 main parts:
- A quick overview of the new architecture for the peer-to-peer (p2p) communications layer in Corda 5.
- Some measurements from our initial assessments of the new p2p layer.
- An explanation of how to take the new p2p layer for a spin.
Architectural overview
In Corda 5, instead of running a Corda node process, an organization will run a Corda cluster consisting of multiple worker processes. This cluster will be capable of hosting multiple identities belonging in the same or even different application networks. The peer-to-peer layer enables these identities to exchange messages with each other regardless of whether they reside in the same or different clusters, as shown below.
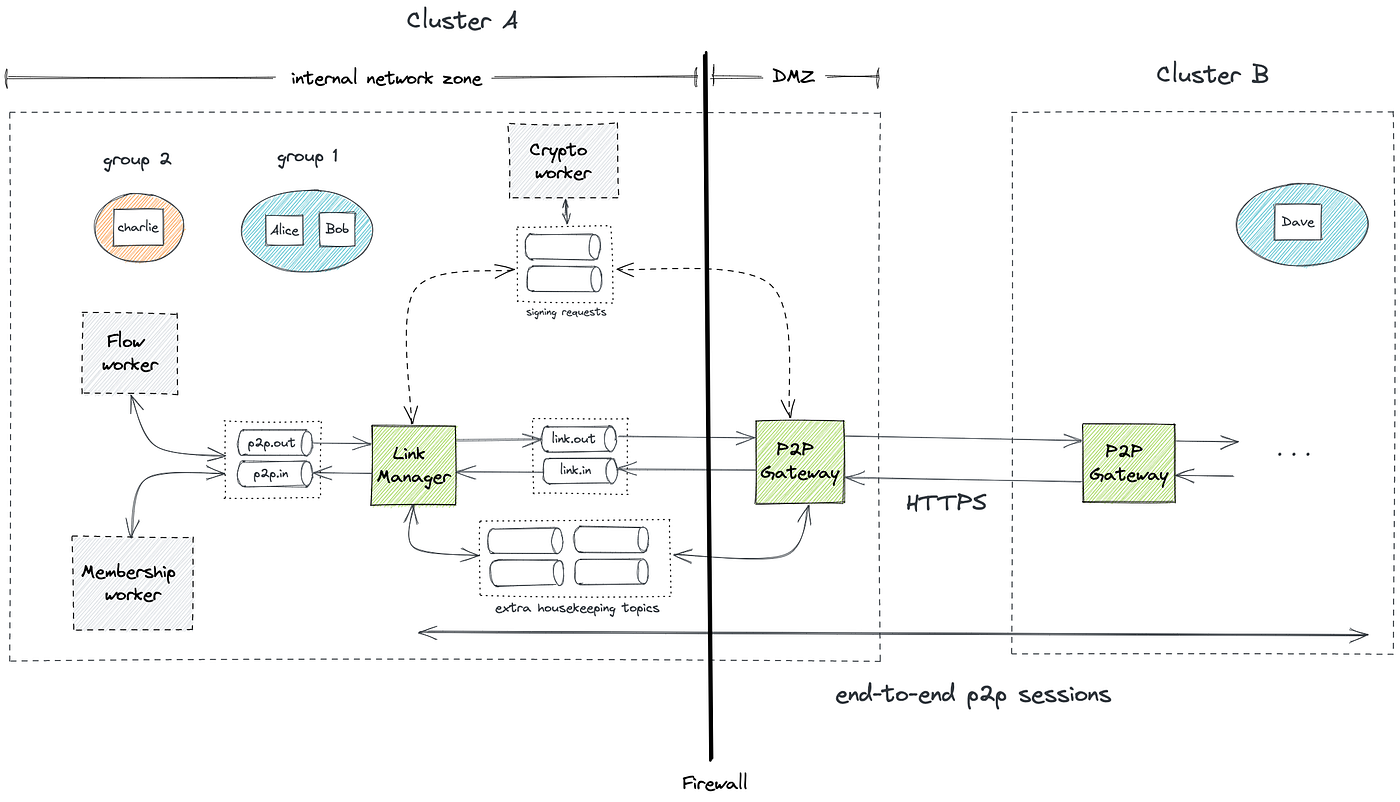
Architecture of the p2p layer in Corda 5
The p2p layer consists of two main workers: the link manager and the p2p gateway. The link manager is typically located in an internal network zone and it is responsible for establishing mutually authenticated end-to-end sessions with link managers from other clusters and transferring messages in a secure and reliable way. If the destination identity is hosted in the same cluster, the link manager can route the message internally.
The gateway is the Internet-facing component and it is responsible for establishing TLS connections with the gateways from other clusters and sending or receiving messages via HTTPS. The link manager and the gateway communicate via a message bus, which can take different forms depending on the deployment mode. The p2p preview provides the fully distributed deployment mode, where the link manager and the gateway are executed as separate worker processes and the message bus is Apache Kafka.
As shown in the diagram, on top of the Kafka topics used to transfer messages, there is a set of extra topics used for housekeeping tasks from the p2p components. For example, some topics are used to keep track of undelivered messages or maintain a mapping between an end-to-end session and the link manager instance hosting it. Higher-level application components that want to make use of the p2p layer can do so via a set of topics, which can be used to send messages to other identities (p2p.out) or receive messages from other identities (p2p.in). An example of such a component is the so-called flow worker, which will be executing Corda flows that might need to send or receive messages. Another example is the membership worker, which will use the p2p layer to register identities into application networks and propagate membership information to the various network members.
A cluster in Corda 5 can host multiple identities, which can belong to the same or different application networks. An identity will first register with the membership group manager (MGM) of the corresponding network before it can communicate with other members of the network. The membership worker will be responsible for registering an identity in a network and ensuring the cluster has an up-to-date view of the membership information inside that network.
The link manager and the gateway will need to perform signing operations during the TLS handshake and the negotiation of end-to-end sessions. This signing will be performed by the so-called crypto worker, which will be able to do that in a secure way, e.g. by communicating with hardware security module devices (HSMs) that store the cryptographic keys in a tamper-proof way. The link manager and the gateway will send signing requests to the crypto worker via the same message bus.
***
Some of the components outlined in the architecture above are not yet fully developed or integrated, so the p2p preview contains the necessary replacements to allow for the p2p layer to be used on its own. These are the following:
- Instead of the flow worker, we provide a simpler application called app-simulator, which can be used to send and receive messages using the p2p layer.
- Instead of the membership worker, we provide some tooling that allows you to set up application networks and add members to them locally in a cluster without having to communicate with the MGM.
- Instead of the crypto worker, the link manager and the gateway perform signing internally and we provide some tooling that allows one to upload the cryptographic keys in the Kafka cluster in order for that to work properly.
These missing parts are currently in development and will be available soon in our next milestones.
Results from our initial assessment
After we completed the development of this initial version of the p2p layer, we wanted to evaluate its horizontal scalability and high availability. In this part, we share the results of this assessment with you and we invite you to perform your own experiments and share the results with us.
For this purpose, we created a deployment of two Corda clusters in the cloud using Kubernetes with one identity hosted on each cluster. We grouped all instances of each worker type in a single stateful set (i.e. one stateful set for all the link managers, a separate one for the gateways, etc.). We also created a headless service for the gateways and used its DNS name to bind the TLS certificate to. To simplify the analysis, we generated application traffic in one direction from the first cluster (called the sender cluster) to the second one (called the receiver cluster). We assessed horizontal scalability by increasing the number of worker instances on each cluster and observing the increase in throughput achieved by the system. We assessed high availability by injecting failures in the various p2p components of the system and observing the impact of those failures in terms of message delivery. The topology we deployed is summarized in the diagram below. Using Kubernetes resource requests, we allocated:
- A minimum of 1 CPU and 2GB for every p2p pod.
- A minimum of 1 CPU and 4GB for every Kafka broker pod.

After an experiment was run, the data in the PostgreSQL database was used to:
- Confirm that no messages were lost, by reconciling the set of sent messages with the set of received messages.
- Perform time window aggregations to analyze the throughput of the system (in messages delivered per second) and the delivery latency of messages (time elapsing between the point when the message was sent and the point when it was received).
Assessing high availability
For this experiment, the setup of each cluster consisted of:
- 3 Kafka brokers and 1 Zookeeper node.
- 3 link manager instances and 3 gateway instances.
- 1 simulator in
SENDERmode in the sender cluster. - 1 simulator in
RECEIVERmode and 1 simulator inDB_SINKmode.
The experiment consisted of the following steps:
- We generated traffic from the sender cluster directed to the receiver cluster using the app-simulator. The parameters were the following: a total of 10,000 messages in batches of 10 messages with a delay of 100ms between every batch and a message size of 1KB.
- We waited for 30 seconds.
- We emulated a failure of a p2p component by scaling down the corresponding stateful set by one unit.
- We waited until all 10,000 messages were sent by the app-simulator and received by the other side.
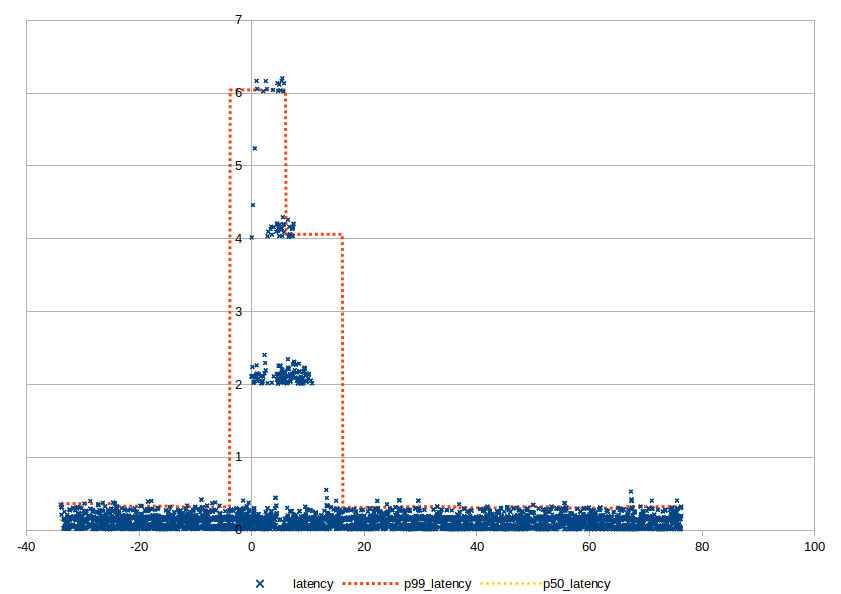
The diagrams below show the results of the experiment for each different type of failure. The vertical axis corresponds to the end-to-end latency of a message in seconds (e.g. the time between sending a message and the message being successfully received on the other side). The horizontal axis corresponds to the time elapsed in the experiment with zero being the time the failure was injected. The blue data points correspond to latencies of individual messages, the orange line corresponds to the 99th percentile latency and the yellow line corresponds to the median. The aggregate statistics are calculated over a 10 second time window. This combination of individual data points and aggregate statistics can help us get a good understanding of the system’s behavior for the average, best and worst case.
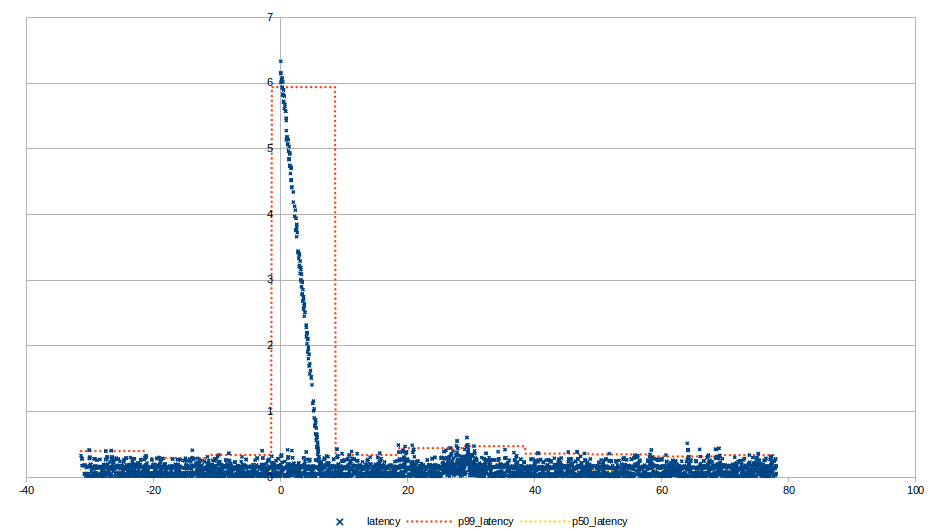
Failure of a sending link manager
In this scenario, after a configurable amount of time, the failed link manager stops processing data from Kafka, the brokers identify it failed and distribute its partitions to the other healthy link managers. This process is known as “rebalance”. As a result, the remaining link managers pick up the slack from the failed link manager bringing the system back to a stable state. We expect a portion of outbound messages to be temporarily delayed during that period. This timeout can be configured and establishes a trade-off between faster recovery and potentially unnecessary rebalances in Kafka during transient network issues.
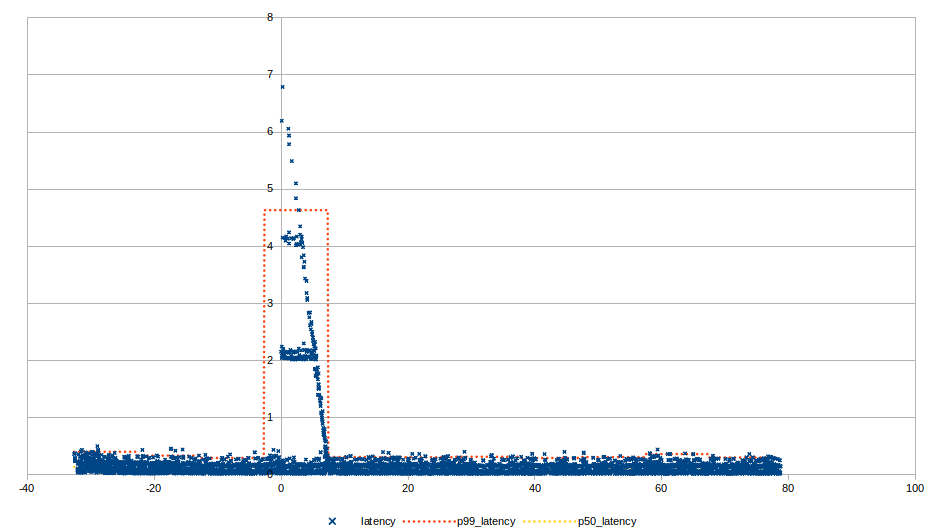
Failure of a sending gateway
Similarly to the previous scenario, after rebalance kicks off, the remaining healthy gateways are able to pick up the partitions of the failed gateway. One notable difference here is link managers load balance messages between the available gateways, so messages that were originally sent to the failed gateway will be resent after some period and might end up in one of the healthy gateways resulting in faster recovery.
Failure of a receiving gateway
In this scenario, any sending gateways that had established connections with the failed receiving gateway switch over to one of the other healthy receiving gateways.
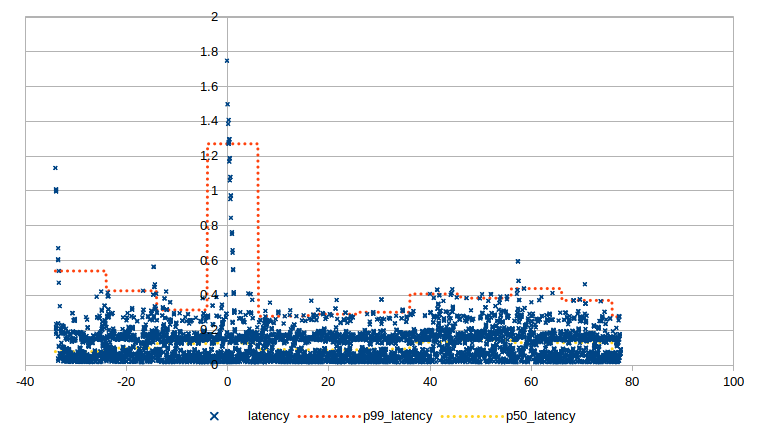
Failure of a receiving link manager
As we mentioned previously, link managers maintain end-to-end sessions with each other. When a link manager crashes unexpectedly, all the ephemeral cryptographic keys held for these sessions in memory are lost. The link managers include failure detection mechanisms, so they eventually identify lost sessions and start establishing new ones. They also maintain redundant sessions for a single identity, so that they can fail over between them until newly established sessions replace the lost ones. This is why in this scenario, an increasingly small amount of messages are replayed in every round. The selection between the available sessions is based on a weighting mechanism that calculates the health of the sessions based on the recency of heartbeats.
A common observation for all the previous scenarios is that the failure affects only a part of the system proportional to the size of the failure, which is a desired property of a highly available architecture. This means that a general approach to reduce the blast radius of an individual failure is to increase the number of running instances.
Assessing horizontal scalability
For this experiment, we used the following setups, basically doubling capacity of the cluster every time:
- Setup A: 3 Kafka brokers, 1 link manager instance, 1 gateway instance, 1 simulator instance in
RECEIVER/DB_SINKmode. - Setup B: 3 Kafka brokers, 2 link manager instances, 2 gateway instances, 2 simulator instances in
RECEIVER/DB_SINKmode. - Setup C: 3 Kafka brokers, 4 link manager instances, 4 gateway instances, 4 simulator instances in
RECEIVER/DB_SINKmode. - Setup D: 7 Kafka brokers, 8 link manager instances, 8 gateway instances, 8 simulator instances in
RECEIVER/DB_SINKmode. - Setup E: 13 Kafka brokers, 16 link manager instances, 16 gateway instances, 16 simulator instances in
RECEIVER/DB_SINKmode.
The experiment consisted of generating an increasing amount of load on the system up until the point the average latency over a 10 second time window crosses the threshold of 1 second, indicating the system started getting overloaded. The maximum throughput observed before this point was selected as the maximum throughput achieved for this setup. In terms of parameters for the load generation, we used 10KB messages in batches with 50 ms delays between them and we increased the load by increasing the size of the batch and the number of simulator sender instances.
The diagram below shows the maximum throughput for each setup described previously. As you can see, the system can scale horizontally achieving higher throughput (measured in messages transferred per second) as we increase the capacity of the cluster.

How to deploy & use the p2p layer
In this part, we explain how you can set up p2p clusters and exchange messages between them.
Building the necessary artefacts
The first step is to build all the necessary artifacts. First, make sure you have cloned locally all the repositories needed and enabled composite builds as explained here. Make sure that you have checked out the p2p-preview tag for every repo, so that you have a stable version of the software. Then, you can follow the instructions provided in the README files referenced below to build the artifacts needed:
- The link manager worker.
- The p2p gateway worker.
- The app-simulator.
- The kafka-setup tool. This can be used to create the required topics with the expected configuration in Kafka.
- The p2p-setup tool. This can be used to create application networks, add members, publish configuration and keys to the cluster.
- The fake-ca tool. This can be used to generate TLS certificates from an auto-generated certificate authority purely for testing purposes. Alternatively, you can get certificates issued from a real certificate authority.
Setting up a p2p cluster
After building all the artifacts, you can now deploy a p2p cluster by following the steps below:
1. Deploy a Kafka cluster, which can be done in any way you prefer. We assume a Kafka cluster has been deployed with at least one broker listening for connections on the address kafka-cluster:9092.
2. Create the necessary topics in the cluster. You can do this using the kafka-setup tool and our sample file containing configuration for all the topics needed (e.g. by running java -jar -Dbootstrap.servers=kafka-cluster:9092 corda-kafka-setup.jar --topic p2p-kafka-setup-example.conf). You can adjust the number of partitions and replication factor in the configuration file if you want, but the rest of the configuration should be left intact. The number of partitions for each topic need to be larger or equal to the the number of worker instances you plan to deploy.
3. Deploy the link manager worker (e.g. by running java -jar corda-p2p-link-manager.jar -k=kafka-cluster:9092 -i=1). You can deploy multiple instances using a different -i value for each one.
4. Deploy the gateway worker e.g. by running java -jar corda-p2p-gateway.jar -k=kafka-cluster:9092 -i=1. Similarly, you can deploy multiple instances.
5. Upload the configuration for the link manager and gateway workers in Kafka using the p2p-setup tool. The link manager has no required configuration parameters (they are all optional with sensible defaults), but the gateway has one required parameter (the port it will listen to). Using the--help option, you can see all the available configuration options. An example command to publish the config using all the defaults available for both workers is the following:

At this point, the workers of the cluster should have started running successfully. The next set of steps are needed to create an identity in the cluster, create an application network and add the identity to that network.
1. Create a session key pair for each identity hosted in this cluster in PEM format. One way to do that is using the openssl tool as shown below:

2. Create TLS keys and get a TLS certificate from a certificate authority (CA) in PEM format. You need to ensure that the domain of the certificate resolves to the IP address the gateway is configured to listen to. You can get a certificate using a well-known trusted CA or you can use the fake-ca tool in the following way:

This command will create a certificate authority, store its root certificate in the local filesystem and also create a TLS key pair and TLS certificate for www.alice.net from that same certificate authority.
3. Upload the session & TLS keys to the cluster using the p2p-setup tool.
For instance, to upload the session key you can create a file (alice_session_key.json) with the following structure:

Upload alice_session_key.json to the cluster using:

The tenantId is used to store keys in isolated sections and the value specified for each key needs to match the tenant IDs specified later when creating a new identity (tlsTenantId, sessionKeyTenantId).
You need to follow the same process to upload the TLS key.
4. Create an application network using the p2p-setup tool.
You need to create a file (group.json) with the following structure:


5. Create a locally hosted identity on the cluster using the p2p-setup tool.
To do that, you need to create a file (alice_identity.json) with the following structure:

Publish alice_identity.json using:

6. Add the identity as a member of the network.
To do that, you need to create a file (alice_member.json) with the following structure:

Publish alice_member.json using:

The DNS name in the address field needs to resolve to the IP address of the gateway and the port needs to match the port the gateway is configured to listen to.
Note: You will need to repeat this step for every member of the network (i.e. even for members that are hosted in other clusters) in every cluster that has an identity that is a member of this network.
At this point, you should have a fully operational p2p cluster with a single identity hosted in it.
You can repeat the same process to set up more p2p clusters, if you want.
Sending messages to another cluster
To send messages between clusters, we can make use of the app-simulator application. This application can be configured to send metadata about the messages sent and received on a PostgreSQL database for further analysis. This database will need to have some tables to track this data, as specified here. We assume you have one deployed and listening for connections on app-simulator-db:5432.
In order to process incoming messages in a cluster, you need to run the app-simulator in RECEIVER mode. To do that, you can create a configuration file (simulator_receiver.conf) with the following structure:

Then, you can run the app-simulator with this configuration using:

In order to forward metadata from received messages to the PostgreSQL database, you need to run the app-simulator in DB_SINK mode. To do that, you can create a configuration file (simulator_sink.conf) with the following structure:

Then, you can run the app-simulator with this configuration using:

To send messages from one cluster, you need to run the app-simulator in SENDER mode. To do that, you can create a configuration file (simulator_sender.conf) with the following structure:

Then, you can run the app-simulator with this configuration using:

After following these steps, you can inspect all the messages that were sent or received along with their timestamps on the database.
***
We hope this initial preview of the p2p layer of Corda 5 gets you as excited as we are! Of course, this is just the beginning. We will continue working hard to complete the development of the pieces that are missing and further improve on some areas we have already identified. So, stay tuned!
If you have any feedback, please let us know at [email protected].