Performance improvements in Corda Enterprise 4.4 and 4.5
June 29, 2020
By Dimos Raptis, Software Engineer at R3

In the last two versions of Corda Enterprise (4.4 and 4.5), we released a number of features that significantly improved the performance of Corda Enterprise. Our work in the past has focused on improving throughput, which is typically measured by the number of transactions completed per second (TPS).
However, we have seen a number of use cases where latency is also a critical factor, especially where there are transactions of high value and a large number of participants with long transaction chains. We knew that reducing latency would be good news for Corda Enterprise users working within capital markets and supply chain financing, or other use cases where there are multiple parties to a transaction and settlement speed is critical.
Our newly released features have been designed to reduce latency to benefit all these use cases, while also driving throughput improvements. This time we wanted to put some numbers on our performance improvements, so we took the opportunity to perform a detailed analysis on the benefits of these features. The results are in, and we are glad to share them with you in this post.
The numbers
As a result of our analysis, we observed a reduction in latency up to 13 times and an increase in throughput up to 35% between Corda Enterprise 4.3 and Corda Enterprise 4.5. Any organisation using Corda Enterprise for purposes that involve signature collection and communication of the finalised transaction to multiple participants will see a substantial improvement if they upgrade to 4.5 (or 4.4). Specific industries can make use of tuning features to improve performance even further.
For users of Corda Enterprise, we found that a simple upgrade from 4.3 to 4.5 automatically improves performance, without additional tunning.
Read on to check our analysis methods and see full test results.
Feature Overview
The features covered here are:
- Optimised transaction backchain resolution through the use of bulk requests, introduced in version 4.4. Using this feature, Corda Enterprise nodes will now be able to resolve multiple states at a time.
- New tuning options that can control the rate at which Artemis flushes messages to disk and sends acknowledgements back to the client, introduced in version 4.4.
- New sendAll API that can be used to send messages to multiple counterparties in parallel in a more efficient way, introduced in version 4.5.
- p2p message compression, introduced in version 4.5.
- New parallelised flows (CollectSignaturesFlow, FinalityFlow), introduced in version 4.5. These flows will now perform all the associated logic in parallel across all the involved nodes, including collecting signatures, sending the finalised transaction and performing any transaction resolution that might be required.
Test setup
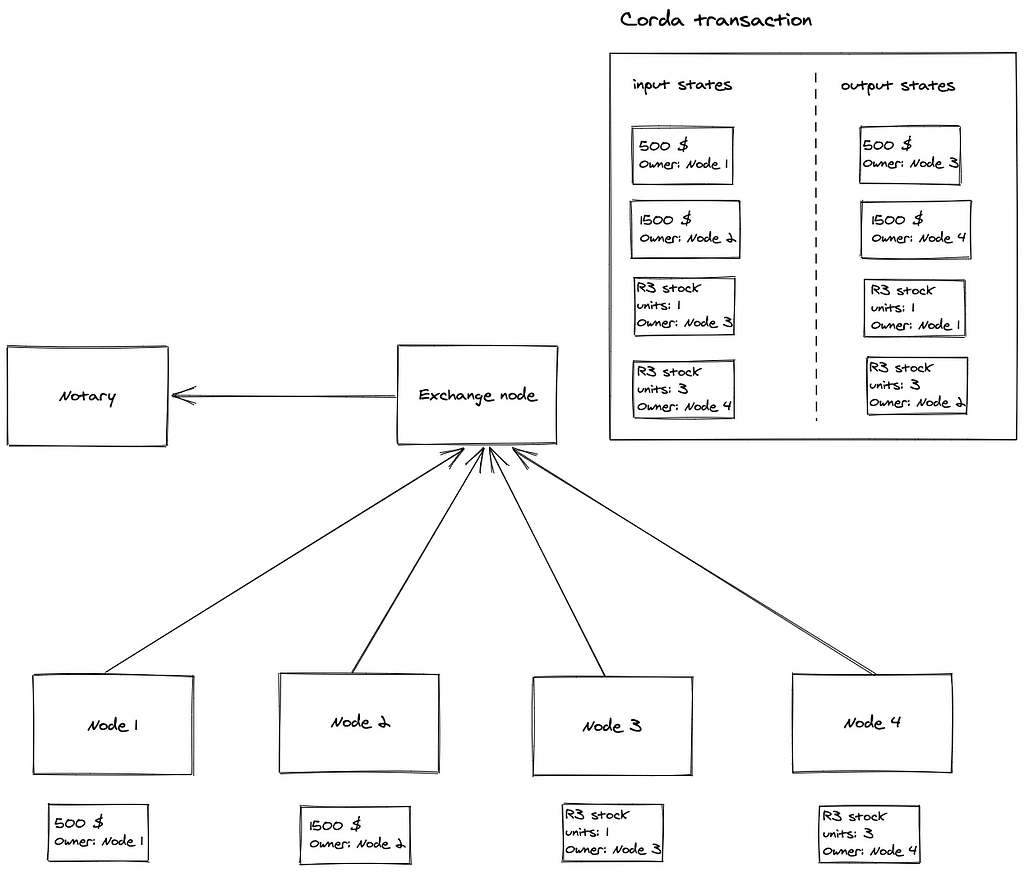
To perform our analysis, we developed a new CorDapp that could exercise scenarios with multiple nodes. In this context, a node can represent a party owning an asset or a party coordinating an exchange of assets between parties. This CorDapp modelled a simplified asset exchange with two basic asset classes – cash and stocks – where each asset was represented by a Corda state. This Corda state shows who holds an asset, how much it is worth and other key details.
The exchange node is responsible for issuing these assets to the various nodes in the network and coordinating the exchange of these assets between multiple of these nodes in an atomic way. This is achieved by creating a transaction with the appropriate input and output states for the assets that are transferred, calling CollectSignaturesFlow to collect signatures from all the parties that own the assets to be transferred, and then calling FinalityFlow to finalise the transaction and send it back to all the involved parties. The diagram below contains an illustration of such a network with 4 nodes that perform a swap transaction between each other.
Running the test
Our tests were focused on two basic aspects of performance: latency and throughput.
In both cases, we deployed a single exchange node and a set of N normal nodes, which were split into two groups A and B of size N/2 each. The first group was initially issued cash states and the second group was issued stock states.
Each node from the first group formed a pair with a node from the second group. These pairs indicated the nodes amongst which the swaps of assets would be performed. Each Corda transaction that was performed during the test swapped two assets between the nodes of each pair. So, each Corda transaction had N inputs and N output states, which modelled the transfer of N assets.
When testing throughput, we generated load from multiple RPC clients to the exchange node triggering multiple, concurrent flows that executed the transactions described previously. This was done in order to saturate the nodes and achieve the maximum throughput possible. When testing latency, we generated load from a single RPC client that was expecting one flow at a time. This was done intentionally in order to measure the latency of the flow without overloading the nodes.
In the latency tests, we also generated a backchain by transferring bilaterally the states between the nodes of each pair before proceeding with the swap transactions, so that we could isolate the benefits derived from bulk transaction resolution and parallelised flows. We also repeated the experiments with a single exchange node and a varying number N of regular nodes (ranging from 2 up to 10) in order to measure the scaling with regards to the number of participating nodes. The structure of the CorDapp and the topology of the network were selected based on the setup of our customers in the asset exchange space in order to replicate realistic production scenarios as much as possible.
In total, we executed 3 basic tests:
- A latency test comparing the versions 4.3, 4.4 and 4.5. The specific measurement of 4.4 was done intentionally, in this case, to quantify the effects of a backchain, as described above.
- A throughput test comparing the versions of 4.3 and 4.5.
- A combination of throughput and latency measurements, where different configurations of Corda Enterprise 4.5 were used. The goal of this test was to provide some intuition on the behaviour of these parameters and evaluate the default options.
Environment setup
For cost-efficiency reasons, we deployed multiple Corda nodes on each machine in some cases. Replicating the same tests with one dedicated machine for every Corda node is expected to achieve even better results in absolute terms, but the relative differences between versions we study in this post are a good representation of the improvements between Corda Enterprise versions.
Specifically, we had four dedicated machines that hosted Corda nodes and four dedicated machines for hosting databases for them. Two of those machines were used to host the notary and its database. The remaining six machines were used to host the remaining Corda Enterprise nodes and their databases.
PostgreSQL was used as a database, and in order to host the database of multiple Corda nodes in a single machine, we run a single PostgreSQL instance with multiple schemas, one for each node. We tried to split the nodes as evenly as possible. So, two machines hosted four nodes and one machine hosted 3 nodes, totalling 11 nodes, as described above. Similarly, two machines hosted four database schemas, and one machine hosted three schemas accordingly.
All these machines were based on Intel Xeon E5–2687W v4 and had 24 cores (48 hyper-threads) with 256GB RAM and local SSDs interconnected with a 10GBps network.
Results
Latency test
To test for latency, a pre-defined number of flows (400) were executed from a single client running on a separate machine, as described above. A backchain of depth 10 was generated for every state via bilateral transfers. We performed measurements starting with four nodes and going up to 10 nodes. This test required at least two pairs of nodes in order to trigger transaction resolution. We also repeated the test three times with versions 4.3, 4.4 and 4.5. The diagram below shows the results of this test, where the x axis indicates the number of nodes participating in the test and the y axis indicates the average latency of the flow that performed the asset swap in milliseconds.
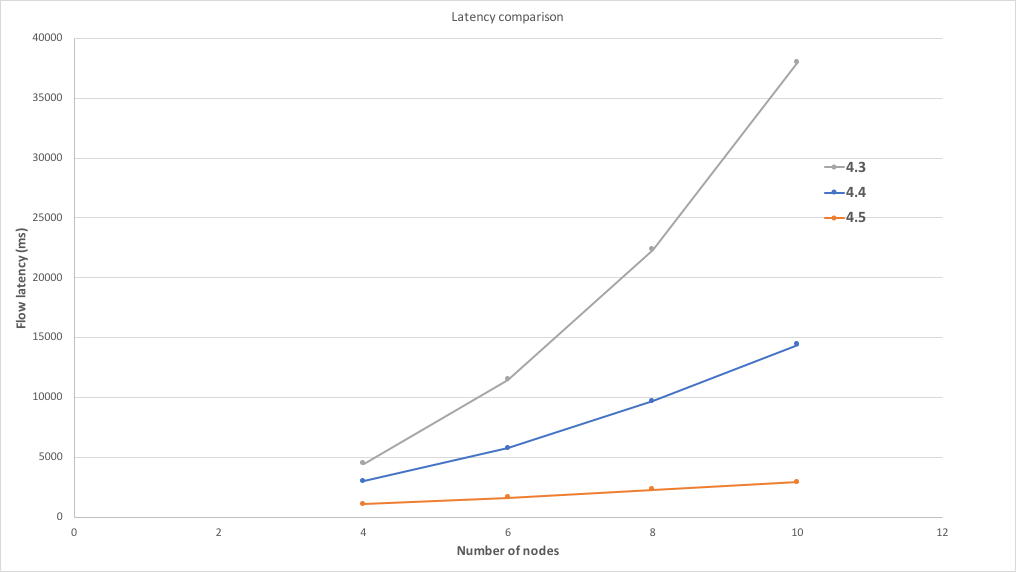
We can observe that version 4.4 improves over 4.3 significantly thanks to the bulk transaction resolution and 4.5 improves even further thanks to the parallelised flows. We can also observe that 4.5 scales almost optimally, since the increase in latency from additional nodes is minimal.
Throughput test
To test throughput, the load was generated concurrently from 480 RPC clients that were spread across the four machines that were hosting Corda Enterprise nodes. This was done in order to saturate the participating nodes and prevent the load generator from becoming the bottleneck. Each one of the 480 clients run one flow at a time on the exchange node that was executing a swap transaction between the participating nodes. The diagram below shows the results of this test, where the x axis indicates the number of nodes participating in the test and the y axis indicates the average throughput measured in number of flows completed per second.
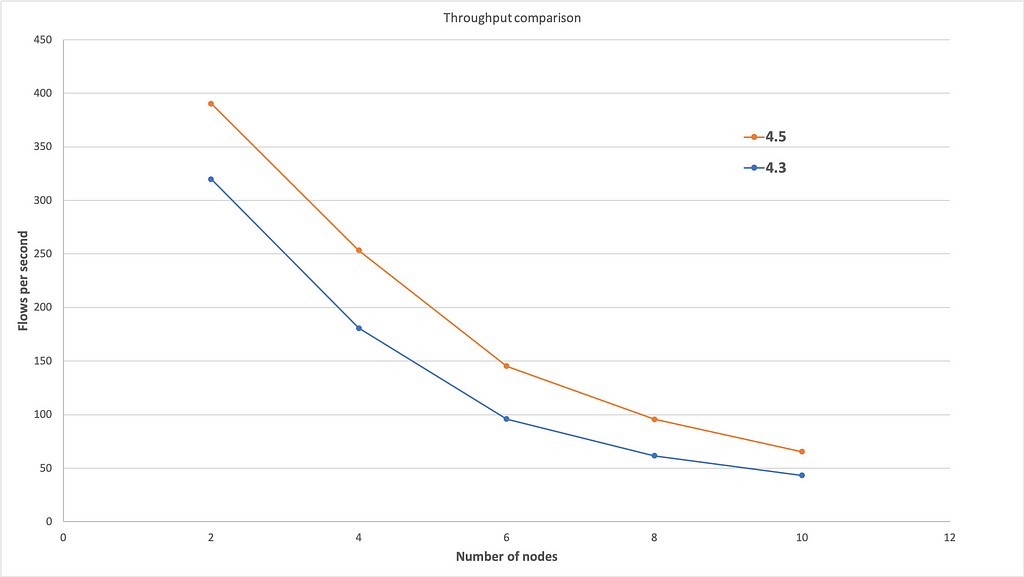
We can observe that Corda Enterprise 4.5 can achieve a significantly higher throughput when compared to 4.3. This can be attributed to the following factors:
- Flows that are now executing in parallel have significantly lower latency, as shown before. This reduced latency means nodes are able to complete more flows in the same amount of time, thus achieving higher throughput.
- p2p messages between nodes are compressed, which can lead to a more efficient use of network bandwidth.
- The parallelised flows take advantage of the new sendAll API in order to send messages in parallel to multiple parties. This means that a smaller number of checkpoints will be created overall, thus leading to more efficient use of the database.
We can also observe that the throughput decreases as we add more nodes and that the difference between the two versions gets smaller as more nodes participate in the transaction. This is mostly due to environmental issues. As we explained above, we had to deploy multiple nodes per physical machine for economical reasons. This means that as we add more nodes, each machine has to host more nodes and these nodes are sharing physical resources, thus interfering with each other. If the same test is repeated using a dedicated machine per Corda node, it is very likely that a much higher throughput would be observed for both Corda Enterprise versions, with a larger difference between the two versions when more nodes are involved.
Impact of new tuning options
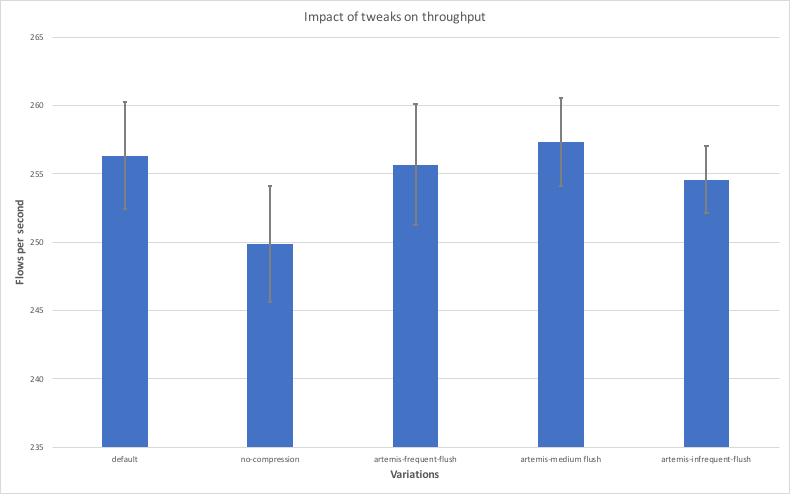
The last test was focused on the impact of some of the new tuning options. The options we covered are those controlling the flush frequency of Artemis buffers (brokerConnectionTtlCheckIntervalMsand journalBufferTimeout) and the option controlling p2p messages compression (enableP2PCompression). You can consult the documentation for more details on these options. We tested five different variations:
- the default configuration, which had brokerConnectionTtlCheckIntervalMs = 20, journalBufferTimeout = 3333333 and enableP2PCompression = true configured. This variation is called “default” in the graphs below.
- a configuration that flushes very frequently. It had brokerConnectionTtlCheckIntervalMs = 1 and journalBufferTimeout = 1000000 configured. This variation is called “artemis-frequent-flush” in the graphs below.
- a configuration that flushes in a medium frequency. It had brokerConnectionTtlCheckIntervalMs = 10 and journalBufferTimeout = 10000000 configured. This variation is called “artemis-medium-flush” in the graphs below.
- a configuration that flushes in a low frequency. It had brokerConnectionTtlCheckIntervalMs = 20 and journalBufferTimeout = 20000000 configured. This variation is called “artemis-infrequent-flush” in the graphs below.
- a configuration that disables p2p message compression. It had enableP2PCompression = false configured. This variation is called “no-compression” in the graphs below.
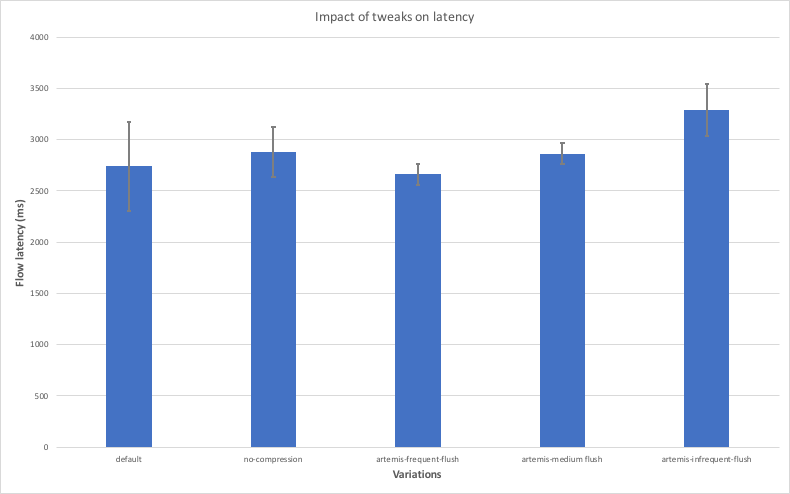
The purpose of this last test was to investigate the effects of these options in both throughput and latency because some of these options introduce trade-offs between these two aspects. To this end, the tests described earlier in this analysis were repeated using the variations listed above. For the latency measurements, 10 nodes were used as we didn’t expect big interference between nodes in the same machine thanks to the low load. For the throughput measurements, only four nodes were used to avoid any interference between nodes in the same machine due to high load. The diagrams below show the results, where the x axis contains the variations used and the y axis shows the average throughput and latency achieved with each variation along with error bars indicating the standard deviation.
The main observations are listed below:
- Disabling compression leads to lower throughput and higher latency. This is expected because compression introduces a trade-off between CPU and network bandwidth utilisation and in most cases the network is going to be a bigger bottleneck.
- The “artemis-frequent-flush” variation leads to lower latency, but also lower throughput. The reduction in latency is thanks to the fact that buffered messages will be sent to counterparties more frequently, thus allowing flows to make progress faster. The decrease in throughput is due to the fact that flushing messages more frequently can lead to a more inefficient use of the disk overall.
- The “artemis-medium-flush” variation achieves higher throughput, but at the cost of higher latency. This is in line with the reasoning described above.
- The “artemis-infrequent-flush” demonstrates both lower throughput and higher latency. This indicates the node enters a somewhat degraded phase, where messages are flushed so infrequently that flows experience long stalls, while the node is not taking full advantage of the disk’s bandwidth.
- The variation that makes use of the default options seems to strike the right balance between latency and throughput.
Key takeaways
The main takeaways are listed below:
- Applications that make use of large backchains are expected to benefit significantly from utilising Corda Enterprise 4.4 or a later version. These benefits will be transparent with no change needed at the application level.
- Applications that make use of CollectSignaturesFlow / FinalityFlow with a large number of participants are expected to benefit significantly from utilising Corda Enterprise 4.5. Benefits will be transparent in this case too with no application-level changes required.
- Applications that send messages to multiple counterparties in parallel are expected to benefit from using the sendAll API introduced in 4.5. In this case, applications will need to migrate from the old send API to the new one.
- Sensible defaults are being used for all the new tuning options that strike a good balance between latency and throughput. These options should be changed only if there is a specific reason and proper performance testing has been performed on realistic workloads to ensure the new values perform better.
More resources
If you want a more detailed description of our performance testing setup, the associated tooling and the results of our experiments, you can have a look at the following pages:
- A more detailed analysis: https://docs.https://corda.net/docs/corda-enterprise/4.5/node/performance-results.html#comparing-corda-enterprise-43-vs-corda-enterprise-45
- Documentation on the performance testing tooling: https://docs.https://corda.net/docs/corda-enterprise/4.5/performance-testing/toc-tree.html#corda-enterprise-performance-testing
Below you can also find links to videos with more a detailed presentation of the features covered here:
- Bulk backchain resolution: https://www.youtube.com/watch?v=muQxj7iyaAs&t
- Artemis tuning options: https://www.youtube.com/watch?v=feAM8HP2CA0
- Parallelised flows, sendAll API and p2p message compression: https://www.youtube.com/watch?v=ZVPFTn4tVhM