Remote Debugging of CorDapps
November 04, 2020
Debugging is a day-to-day job for a software developer. We seldom get the code perfectly correct first time and often find ourselves trying to debug what went wrong. It would certainly be a nightmare for developers if we couldn’t debug applications.
Blockchain applications are no exception. It’s vitally important that blockchain platforms provide the ability to debug Dapps. Fortunately, Corda does a good job with that. CorDapp developers can debug their CorDapps in various different ways, like using a Mock Network, or a Node Driver.
However, these solutions require you to write test cases; flow tests to be able to use Mock Network, and integration tests to be able to use Node Driver. While we absolutely recommend writing test cases, and it’s always a great software development practice, sometimes it happens that things work locally but get messy when deployed onto a real Corda node.
So, what’re the options? How do we debug a CorDapp running on a node? Let’s talk about the remote debugging of CorDapps.
Remote Debugging of a Java Application
Remote Debugging can be enabled in any Java application using JDWP (Java Debug Wire Protocol).
JDWP provides certain command-line arguments that can be used when launching an application that you want to debug. The arguments are:
transport: The value used is generallydt_socketsince it supports processes across machines and OS.server: Allowed values are y/n. It defines how the process attaches to the debugger. If ‘y’ the process is exposed via a debug port mentioned in the address option, otherwise a default port specific to the transport mechanism is used.suspend: Allowed values are y/n. Defines whether the JVM should suspend and wait for the debugger to attach before executing the main class.address: The address at which the debugger would listen, generally a port exposed for debugging.
Remote Debugging on Corda Node
Corda node is a Java application. So, to enable remote debugging on it you could use the below JVM argument:
java -Dcapsule.jvm.args=”-agentlib:jdwp=transport=dt_socket,server=y,suspend=n,address=7005" -jar corda.jar
Once the Corda node is started using the above command, you could use an IDE like IntelliJ IDEA to attach the debugger and start debugging your CorDapps installed on the node.
If you are using a local bootstrapped network and utilizing runnodes to run your nodes, remote debugging is already enabled as you can see below.

Attaching the debugger using IntelliJ IDEA
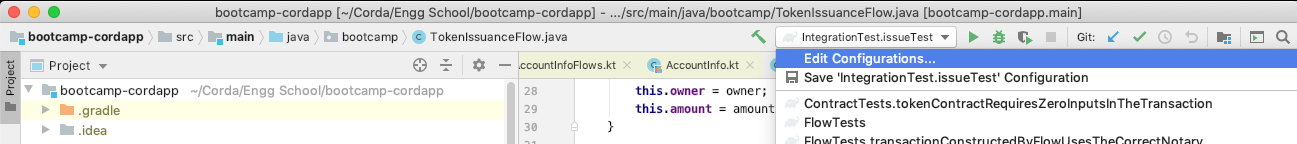
In order to attach the debugger, we first need to create a new debug configuration for remote debugging.
- Click Edit on the Configurations menu:

2. On the Add Configuration wizard, click the + button, then select Remote.

3. Give the configuration a name in the Name field. In the Port field, enter the debug port exposed on the node.

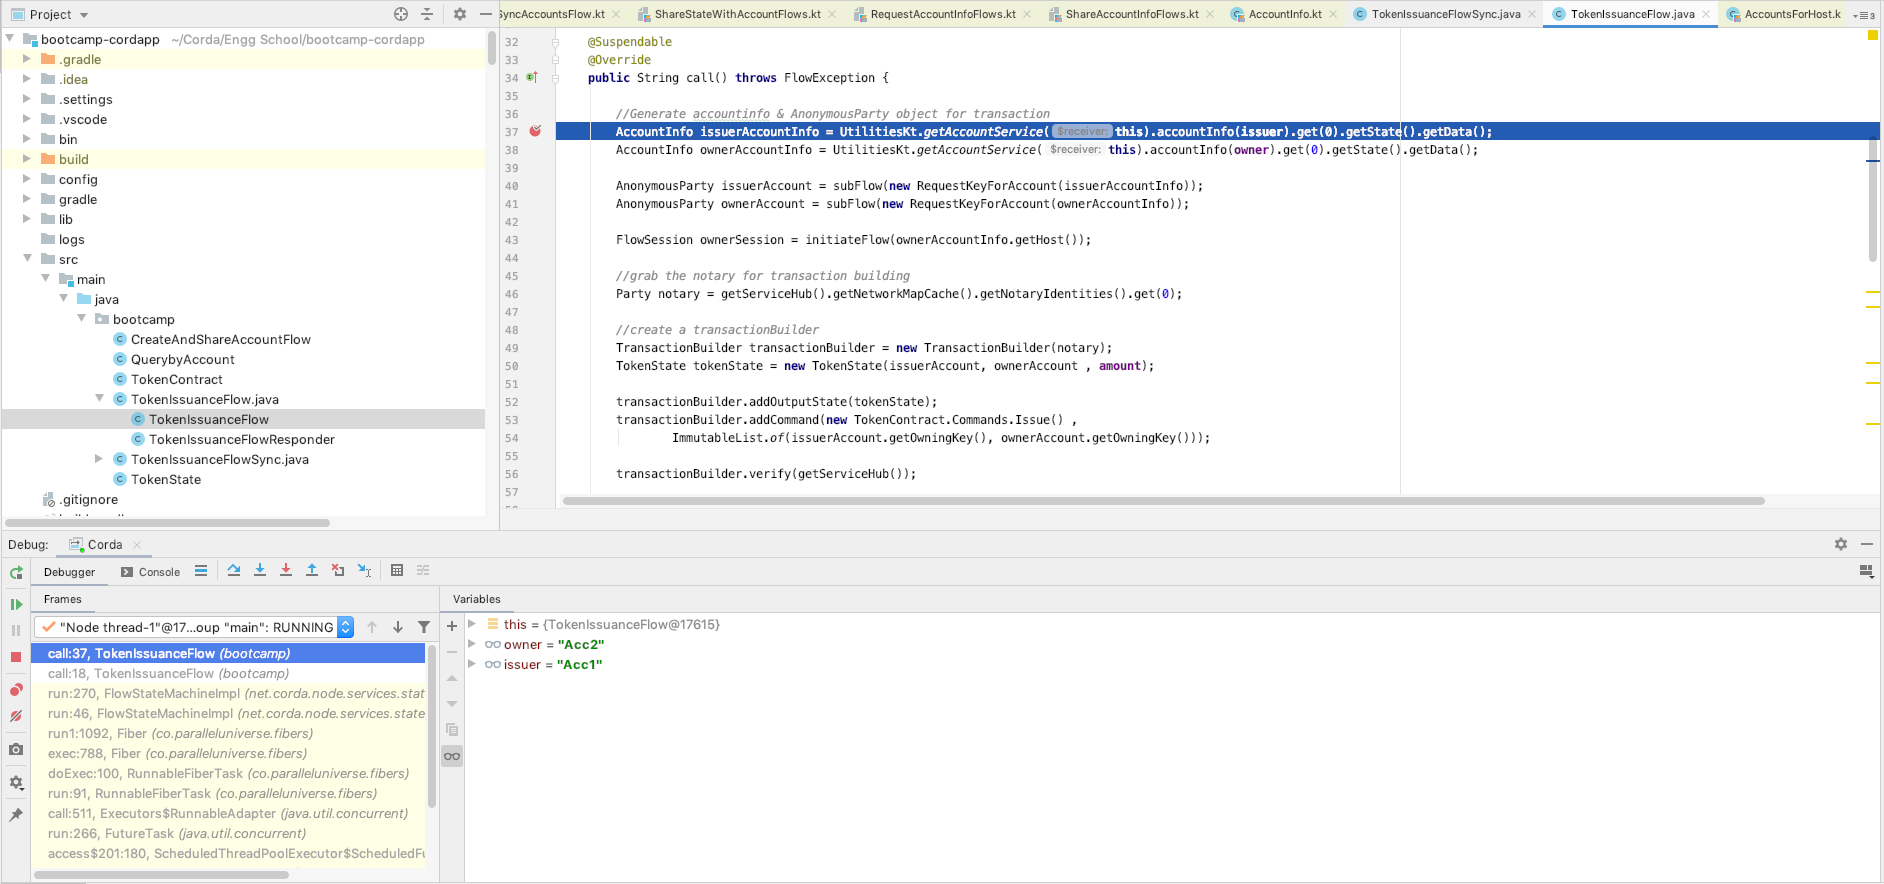
4. Put breakpoints in the code, and start debugging. Once you run the flow on the node, the debugger should stop at the breakpoint.
Thank you so much for reading.
Want to learn more about building awesome blockchain applications on Corda? Be sure to visit https://corda.net, check out our community page to learn how to connect with other Corda developers, and sign up for one of our newsletters for the latest updates.
— Ashutosh Meher is a Developer Evangelist at R3, an enterprise blockchain software firm working with a global ecosystem of more than 350 participants across multiple industries from both the private and public sectors to develop on Corda, its open-source blockchain platform, and Corda Enterprise, a commercial version of Corda for enterprise usage.
Follow Ashutosh on Twitter here.